Hello everyone ! My name is Guillaume (@GuillaumeDecMeetsMore) and I'm a senior software engineer in the Foundation team at MeetsMore.
In this article, we are going to talk a little about API performance. It happens to all of us: we implement more and more new features, making the product better and better, until, at some point, we start to get reports that the website or the application has become slow.
Then, starts the search for slow endpoints and for optimizations that could make everything fast again, just like before.
But, how to do that ? How can we find the parts that are slow ? What are the potential optimizations that could be used for reinvigorating the product ?
Let's take a look at the tools that can help us achieving this. Afterwards, we will talk about some potential optimizations that can help fixing, or at least alleviating, the slowness.
💡 At MeetsMore, we mainly use Typescript with NodeJS. Most of what is mentioned here works with any language, but always check if it's relevant for your use case.
Observability
First, before implementing optimizations, we have to find “where” the API is slow. As we are talking about an API here, we want, more specifically, to find what are the slow endpoints.
To do so, there are a few observability tools that can help. Namely, but not exhaustively:
- logs
- metrics
- traces
- profiles
Let's have a quick look at each one of them.
Logs
Logs are one of the most basic tools for a developer. Without logs, we are nearly blind and cannot see what is happening on the servers. Logs are mainly used for recording what happens in an application. It usually consists of a message and a timestamp, but it can also have some additional metadata.
In my opinion, logs are mostly used for
- Logging errors
- Logging HTTP requests
Here, we are mostly interested by finding which routes are slow. So, the logs of the HTTP requests can help us. Here is an example of such logs.
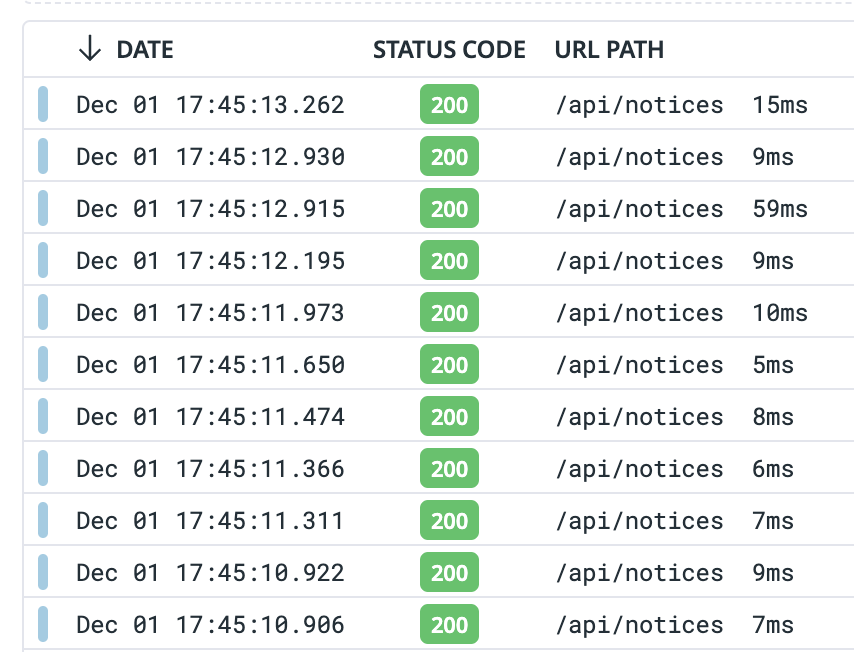
As you can see, we have the URL path (the endpoint), the status code and more importantly the duration. This is already quite useful, but unfortunately they do not provide statistics such as the average duration, nor do they provide information about “why is this route slow”.
Logs in this case only allow to “detect slowness”. They do not give the extent of the problem, meaning they do not provide statistics such as the average duration, the 90th percentile duration, etc. This makes it difficult to know if the slowness is only due to a temporary a problem or not.
For understanding “why is it slow”, we could add logs at each step inside the endpoints, but this would likely exponentially increase the number of logs. Moreover, linking logs together can be difficult. Concepts such as request IDs and correlationIDs can help us, but they usually have to be manually implemented. Moreover, as logs can become quite expensive, it's better to rely on something else for our use case here.
📖 Some observability SaaS, such as DataDog, allow to compute statistics based on logs. Nevertheless, other tools listed below are more adapted to our use case here.
Metrics
Metrics are another tool that allows to detect trends and have statistics. Here is an example:
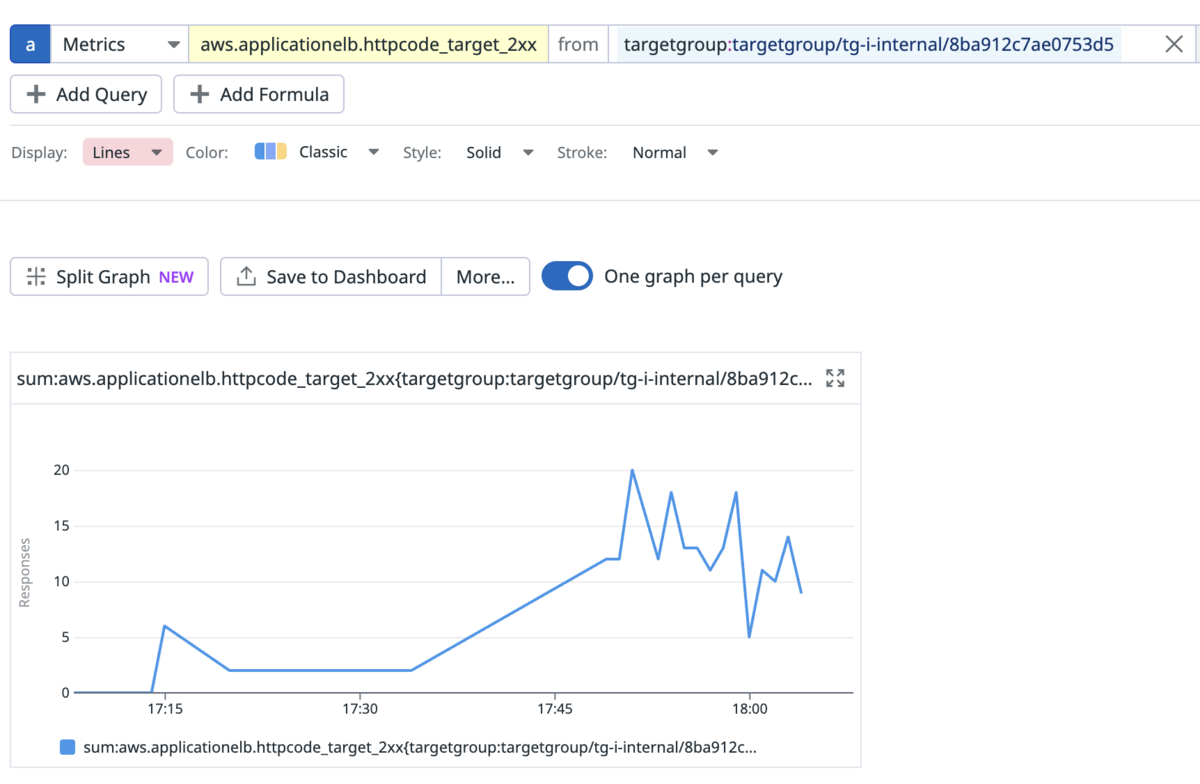
Metrics are mostly useful for seeing trends and detecting anomalies. They are often used for triggering monitors or alerts. Unfortunately, they are rarely useful for debugging slowness.
Note that some observability SaaS can integrate easily with cloud providers and with applications (e.g. NodeJS). Doing so allows to get a lot of metrics by default. However, it's usually not enough and the majority of metrics still have to be implemented manually.
Garbage collector pause time and event loop delay
With NodeJS, two metrics are worth mentioning. They are especially important for performance monitoring:
- Garbage collector pause time
- Event loop delay
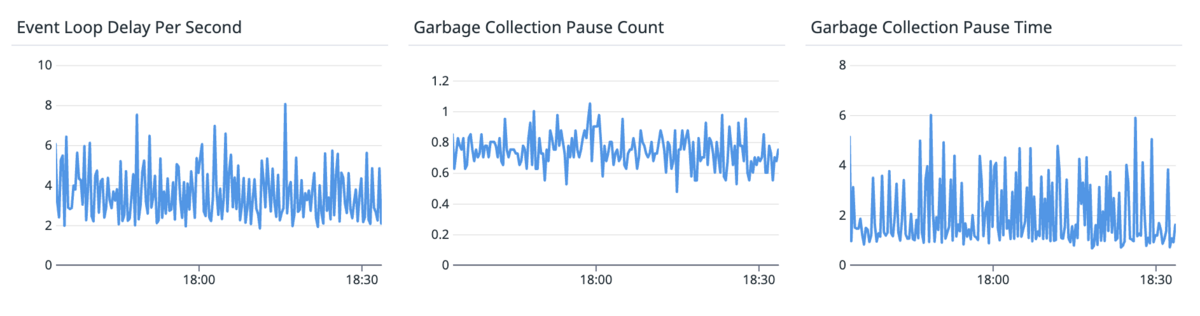
Garbage collector pause time
The garbage collector pause time is the time it takes for the garbage collector to clean the memory from unused data and recover space. During that time, NodeJS is (nearly) exclusively running the garbage collector thread and (mostly) nothing else can be executed.
If an application creates very often a lot of temporary objects, e.g. an heavy HTTP route, then the garbage collector has to clean the memory more often.
This metric typically exists for all languages that have a garbage collector, and in all those languages, it's an important metric to monitor. This metric is usually expressed in milliseconds, and obviously, the lower time it takes for freeing the memory, the better.
Event loop delay
The event loop delay is a metric specific to NodeJS, though other languages with an event loop likely have a similar metric. This metric gives the average time a “completed promise” has to wait before being processed by the event loop.
As you may know, in JavaScript, the event loop is single threaded and there is a concept of “promises” for handling async (aka I/O) operations. A completed promise is, as the same suggests, a promise whose async operation has finished. The event loop's job is to pick up the completed promises and continue the execution after the await or in the .then() handler.
Usually, the event loop does that nearly instantaneously, or, at worst, the promise has to wait a few milliseconds. But, in some cases, the event loop can have a significant delay when it's busy doing other things. The usual example is a CPU heavy task, or the garbage collector mentioned above. This means they monopolize the CPU for a while, and make other tasks wait.
This is, obviously, very bad, as a blocked event loop impacts all routes. More concretely, this means that all ongoing requests on the API have to wait for the event loop thread to become free.
This metric is usually in milliseconds, and the lower time it takes, the better. From what we have seen, an average under 10/20ms is usually good. An average above 50ms becomes worrying.
Traces
Traces are a relatively recent addition to the observability toolbox of developers. They allow to see the operations (e.g. HTTP requests) executed in more details. Traces are composed of spans, each representing a smaller operation.
Here is an example of two NodeJS applications. We can see here that 2/3 of the execution time is due to the call to the second application.
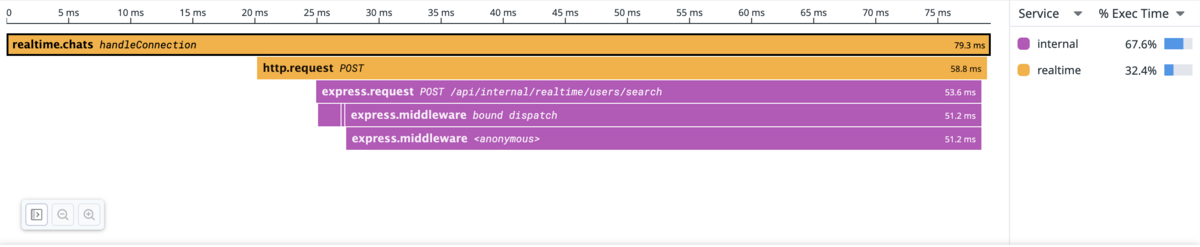
Traces are particularly useful for performance, as they allow to really see what are the slow operations and also see if they are sequential or concurrent. Moreover, they also automatically provide statistics per traces and per spans, such as the average duration or the total time spent.
🛠 Usually, when tracing an API, not all HTTP requests are sampled. Instead, only a percentage is sampled. Traces are pretty heavy in data compared to logs and simple metrics, so they tend to be quite expensive.
Database's profiler
One of the most common reason for having slow HTTP requests is slow DB queries. Fortunately, most databases provide a command or an interface to get the slowest queries.
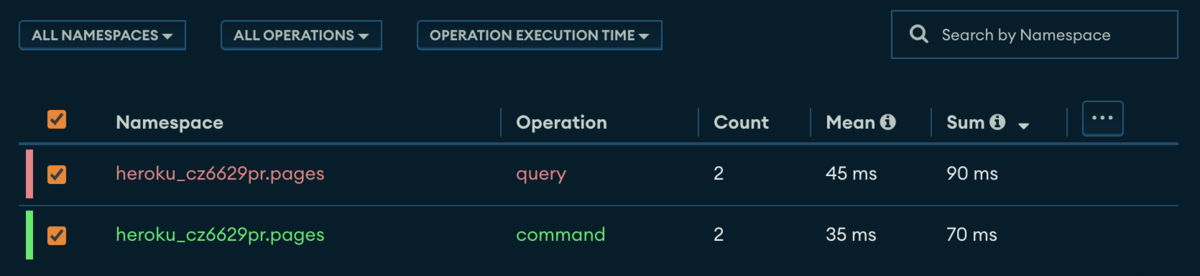
For example, here is the profiler of MongoDB Atlas
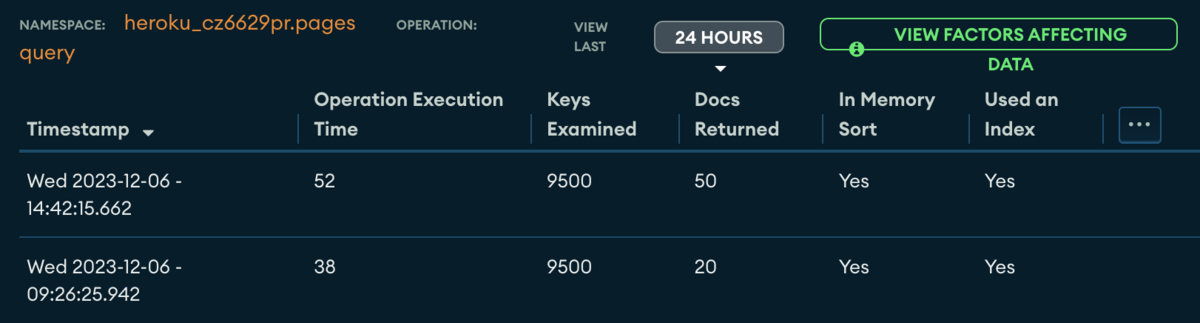
Statistics per collection and operation
Observability data for a specific collection and operation, showing each slow request
Improving the speed of DB queries is usually one of the easiest method for improving the performance of an API. We will talk a bit more about this in the optimizations’ section.
Wall-time and heap profiles
Finally, some observability libraries/SaaS also allow to get wall-time profiles and heap profiles for each application.
Wall-time profile
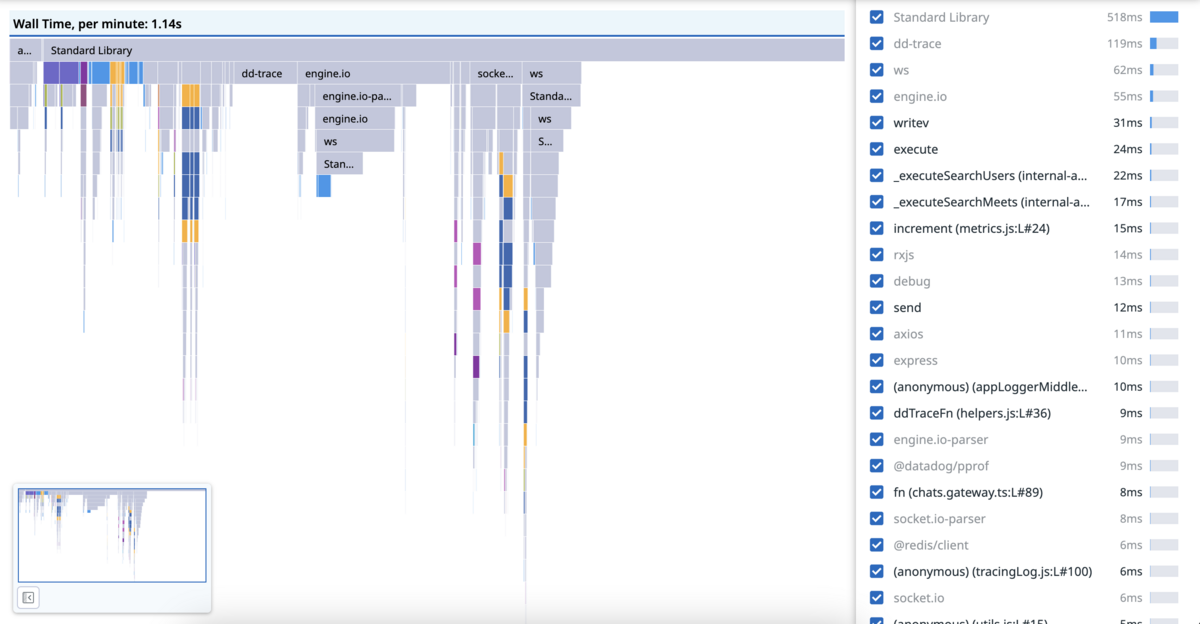
The wall-time profile gives an overview of where the CPU spends time or where we are waiting for I/O. This is useful for detecting functions that are CPU heavy, which, as mentioned, are bad for the event loop.
Unfortunately, for NodeJS with DataDog, we cannot distinguish between “CPU working” and “waiting for I/O”. Therefore, more manual analysis is needed to understand what is the bottleneck.
Here is an example of such profile. It gives the average time spent per minute.
Heap profile
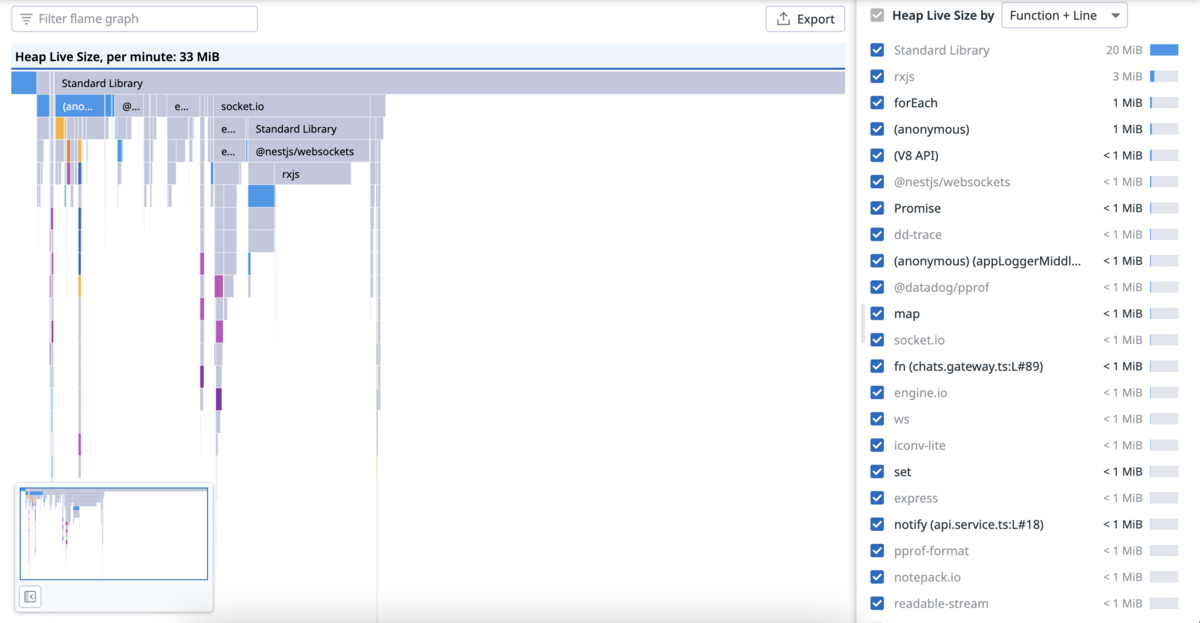
The heap profile, on the other hand, allows to see where and how much memory is allocated. An API that allocates a lot of memory can have bad performances because the garbage collector has to do more work.
Here is an example of this kind of profiles. It gives the average amount of memory allocated per minute.
Optimizations
In this section are listed a few ideas on how to optimize the performance of an API. This list is definitely not exhaustive, but it gives some ways that may be worth testing the next time you are trying to improve the performance of your API(s).
Database optimization ⇒ adding DB indexes
The first optimization is usually to check if adding indexes in the DB could help speed up the queries executed by the slow routes.
It's not always possible, but when it is, it can hugely improve the performance and reduce the load on the DB.
However, indexes have to be carefully created. The choice of the columns or fields is very important for the index performance.
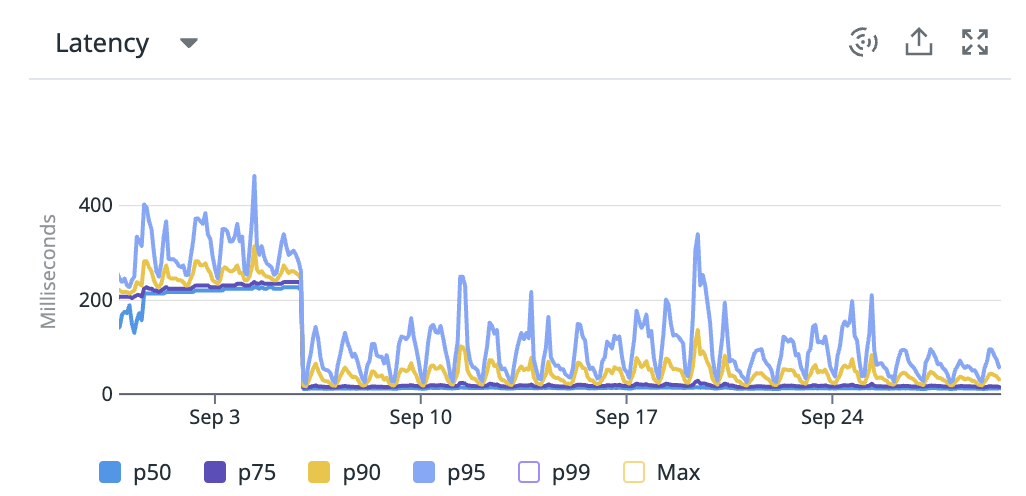
In our case, thanks to the database monitor, we manage to reduce the latency of a few routes by adding efficient indexes. For example, the p50 of the following route went from 200ms to 20ms !
⚠️ Note that having too many indexes on a table or collection can badly impact the performance of the write operations !
If you want to further optimize your database, and more specifically MongoDB, please check the article How do We Optimize MongoDB Latency and Reduce Cost of my colleague Kei (@keidarcy).
Code optimization ⇒ parallelizing I/O
Another simple optimization for reducing the execution time of a route is to check if I/O operations can be parallelized/executed concurrently. For example, let's look at the following endpoint.
@Get()
async getAllProductsAndServices() {
  // Running sequentially
  // Maximum duration is first query + second query
  const products = await this.productsRepository.find()
  const services = await this.servicesRepository.find()

    return { products, services }
}
This example works fine, except that it executes everything sequentially. In this case, the operations can be parallelized as they do not depend on each other.
@Get()
async getAllProductsAndServices() {
  // Running concurrently
  // Maximum duration is one of the 2 queries
  const [products, services] = await Promise.all([
    this.productsRepository.find(),
    this.servicesRepository.find()
  ])

    return { products, services }
}
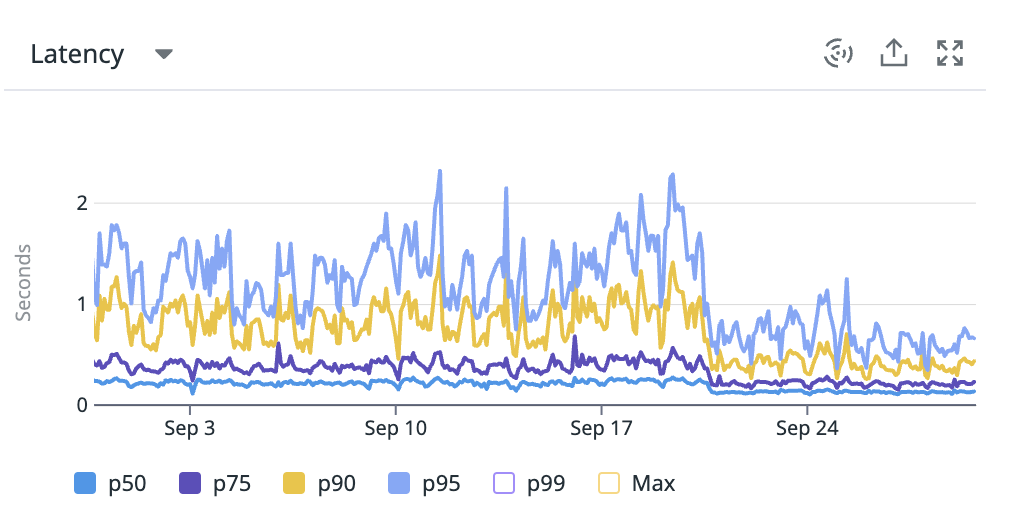
We can see the effect of such change in the following route. The p95 was reduced from ~1600ms to ~800ms. The usage of lean also helped here (more on this later).
📢 It's worth mentioning also that some ORMs run multiple queries behind the scenes. For example, when using
populatewith Mongoose, it will query the main model, retrieve the document, and then query the sub-models. So, if if there are multiple levels ofpopulate, it will sequentially do the same number of round trips to the DB.
Code optimization ⇒ offloading to worker threads
ℹ️ This section is mostly useful for languages that have an event loop.
For endpoints that need to use the CPU quite a bit, for example when computing some AI stuff or for some heavy SSR endpoints, it's possible to offload the CPU computations to a worker thread. More specifically, using worker threads allows to move the computations from the event loop’s thread to other (worker) threads, effectively allowing the event loop's thread to continue processing other tasks.
To do so, the native worker threads module can be used directly, or wrapper libraries such as Piscina can help making the implementation more easy.
We applied this principle in 2 places in our codebase, especially for the SSR rendering. As expected, it didn't speed up the SSR rendering per se, but we noticed a noticeable improvement to the event loop delay.
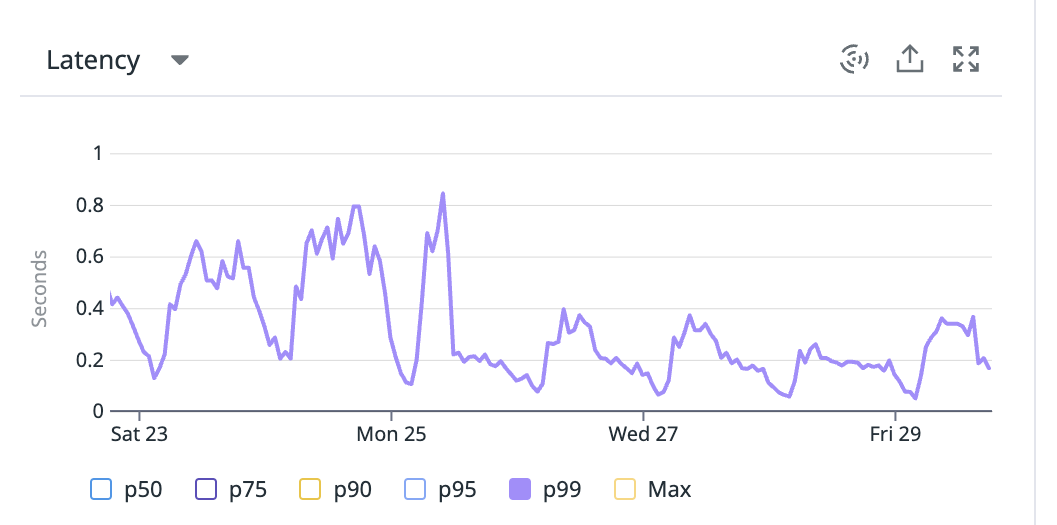
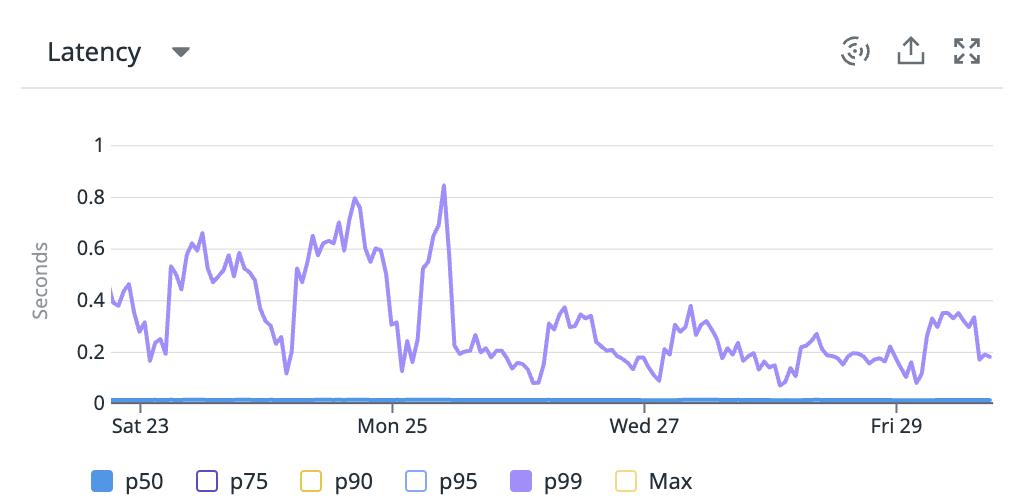
For example, here are 2 small, unmodified, routes that had their p99 improved thanks to this.
📢 Note that NodeJS is usually not the best option for apps that need to do very heavy computations.
⚠️ Note that your API needs to have access to at least 2 CPU cores in order for this optimization to be useful.
Code optimization ⇒ offloading to other instances
Another option for avoiding computations starving the event loop's thread is to move some load to other specialized instances. There are 3 ways for doing this.
Duplicate your API, but only serve a specific subset of routes
This consists of duplicating your API, usually by adding a new set of containers, and make these new instances handle specific routes. For example, if you have some routes that are really heavy on the API, it can help to let specific instances handle this route. This way, the first set of instances handling the normal routes are not impacted and do not get slower.
We are currently using this method for some heavy routes used for background jobs. The instances called by the frontend have become faster and more stable since this change.
Extract the subset of routes
This is a usually the next step after the first option above. The goal here is to move the code of the heavy routes to a new API, and removing the code from the current API.
This can be summarized as “creating a microservice handling specifically the heavy routes”. Obviously, this has a development cost, but it can help for scaling more efficiently the initial API and the new microservice.
Move logic that do not need to be instantaneous to events/jobs
Finally, when some logic does not need to be executed immediately, it can be worth moving the logic to background jobs (to be executed on other instances). This obviously removes load from the API as it has to do less work.
Note that eventual consistency can make things more difficult as it shifts the API from an synchronous system to an asynchronous one, but it is often needed to properly scale.
We are in the process of doing this but don't have yet any metric to share. However, we expect to reduce the pressure on the API, and therefore improve the latency, by moving more and more logic to background jobs handled by other instances.
Code optimization ⇒ only querying and returning what is needed
One optimization that is often overlooked is to make sure to query and return only what is needed. This optimization can be applied at two levels: (1) when querying the DB (2) when returning data from the API.
Depending on the size of the data in DB and the size of the data returned by the API, this can improve the performance quite substantially.
Queries on the DB
This is usually done by avoiding SELECT * , and instead only listing the needed columns.
Returned responses by the API
This can be more tricky.
If you have generic routes such as GET /api/users/:userId, then it's expected to return the whole corresponding object. One solution is to add query parameters for specifying what is needed, e.g. GET /api/users/:userId?include=address .
Another solution is to have specific routes, such as GET /api/users/:userId/address, but this can make things more difficult as the frontend might need to call more routes (e.g. getting the user's address, getting the user's job, …), which could effectively increasing the load instead of decreasing it.
📢 GraphQL is another solution that can help for this.
Code optimization ⇒ avoiding hidden memory allocations
Last optimization for this article, and a very specific one: some ORMs are very useful but can increase the memory allocations quite substantially.
One such example is Mongoose. With Mongoose, a document retrieved from the DB gets a lot of helper functions attached, like .save(), .delete(), etc. All these metadata and helper functions consume additional memory.
We noticed some of our endpoints were appearing in our heap profiles, meaning that they were using quite a bit of memory. For avoiding this overhead, Mongoose allows to use the lean() method (docs) on queries. So, we used it on the queries in the heavy endpoints, which reduced the memory consumption of each one of these by at least 25% !
We have now decided to use .lean() on most queries.
Conclusion
Thanks for reading, I hope the concepts and ideas listed here can help you improve your API, even a little.
Debugging performance issues can sometimes be difficult, but there are now a lot of tools available for helping us in this task, and more will come in the future. We should always do our best to make our APIs as fast as possible: it's good for the UX, it can reduce costs, and it's good for the planet.
And you, what are your ideas for optimizing an API performance ?