Hi! My name is Kei(@keidarcy) and I’m the SRE team leader at MeetsMore, a local services company based in Tokyo.
MeetsMore has been using MongoDB on MongoDB Atlas for over 6 years. Our backend API language is TypeScript, and we use Mongoose as our ORM. While we appreciate the productivity our tech stack has provided, we also find it challenging to improve server endpoint latency and balance cloud costs.

Context
This year, as our active users and product grew, we noticed a significant regression in endpoint response time. This indicated a major issue with MongoDB’s performance. As a temporary solution, we scaled up the production cluster tiers, resulting in around a 40% increase in our billing. The following graphs are the average MongoDB read latency and monthly billing shift before the project. As you can see we were facing a critical period.


Our development team started a project to optimize MongoDB settings, queries, and billing. Here is what we learned from this project.
Configuration optimization
Always Sets Timeout
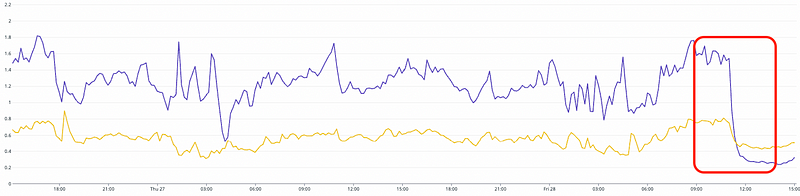
We previously had some large collections with over 100 million rows. Since MongoDB’s WiredTiger engine has limited read/write tickets, if one query takes too long, it could block all other queries, potentially leading to an incident, as shown in the chart below where each dot represents one slow query. And be aware that, the y-axis is minute, which means some queries take more than 1 minute!


To address this, we divided our API server into user-facing API which should always be fast, and background job API which can endure heavier computational latencies. By setting appropriate timeouts for each, we avoided application crashes due to extremely slow queries.
Take Advantage of Secondary Nodes
We use a standard MongoDB replica set with 3 nodes, Primary-Secondary-Secondary (P-S-S). We initially struggled to effectively use the secondary nodes. In the past, I have investigated and found some useful ideas. However, due to priorities, etc., I could not make any changes. This time I didn’t stop until I had an answer and made changes.
We found secondary CPU and Memory were always low. We had assumed that MongoDB would first use all resources in primary node, and whenever necessary it would use secondary. However, it was wrong. We are not taking advantage of secondary nodes.
To better utilize the secondary nodes, I changed the background job server’s “readPreference” to “secondaryPreferred”, and “writeConcern” to “majority”. This meant that heavy queries on the job server would prefer reading from secondary nodes and writing to the primary node and one secondary to maintain data consistency. This change reduced the load on the primary node, enhancing the performance of user-facing APIs.
Connection pool
Managing database connections is resource-intensive and time-consuming due to networking and authentication overheads. A connection pool allows for the reuse of existing connections, but too many connections can also degrade performance and hit OS-level resource limits. We started with Mongoose's default connection size and increased gradually. Because we have multiple auto-scaling API clusters and during the deployment, the connection pool is increased. We build a mechanism to monitor connection count metrics via connectionCheckedOut and connectionCheckedIn event.
Considering that each connection consumes 1Mb MongoDB memory. We used a runtime variable to control connection pool size until we found a satisfactory value.
Queries optimization
Build proper indexes
Creating the correct indexes is the most efficient method to improve read performance. However, how to find what index should be built is not that intuitive.
Here are some tips based on my experiences.
- Create a compound index to cover more queries
Order of single index does not matter({createdAt: 1} is always the same with {createdAt: -1}) so always take this advantage to create a compound index to cover more queries. Looking back periodically and merging some indexes to save space is also good.
- Don't hesitate to create a new index, even "sacrificing" some write performance
After creating multiple compound indexes in a large collection(10 million+ documents), we found that read performance has been significantly improved and write performance sacrificing is acceptable.
- Aggregation is hard to optimize
Some aggregations could be extremely slow, and how to analyze them is hard. I found that checking "explain" after each aggregation stage can help us to diagnose the "problem" stage. And if optimization is too hard, put it to secondary nodes if it's acceptable.
- Understand and "explain plan" to optimize queries
Explain is a powerful tool to help us understand how queries and indexes work. But understanding all the information in the "explain plan" is not easy. Thankfully, MongoDB compass has become a good tool to help us. So take time to read and understand it, it will pay you back eventually.
- Log slow queries and review optimization effect
MongoDB Atlas provides a powerful UI to analyze all slow queries. However, it only persists data of one day. After the index is created or optimized query, it's hard to understand how it works or visualize easily. I exported all slow query data and built similar charts that make checking the impact of optimization easy.

- Write a good query to use a good index
There are some common mistakes like range condition $ne or $nin are bad and use $eq or $in instead, etc. MongoDB also officially has an ESR rule. It's a huge topic that would need another blog post.
Design MongoDB schema
Because MongoDB is a NoSQL database, offers great flexibility in schema design, rather than constructing your application to match a strictly defined data model, you can construct a data model that matches your use case and application functionality.Embedding is recommended, rather than using references (similar to foreign keys in relational databases).
For example, there are major endpoints that return values containing the review count of a user. After I changed it from user.reviews.length to user.reviewCount p90 of one endpoint reduced from 1.5s to 0.3s.
Avoid Unnecessary Data Queries
In the previous user review example, it's not only a database query change, but also a change in the JavaScript side. After the database returns a large payload then mongoose(ORM) validates and parses the payload to JavaScript which is a heavy operation blocking the event loop. And list queries should always be paginated to avoid crazy long lists which is usually unnecessary.
The result after all optimization
As a result, we successfully solved major performance issues. In the average read latency graph over a year, you can find how much improved compared to the latency before the project.

Specifically, for slow queries, we achieved significant improvements, as shown in the chart below. We got all user-facing slow queries down from 9 seconds to around 2 seconds.


Cost reduction
After all performance optimization, we came back to solve the billing issue. First, we found out CPU usage is very low, so we reduced CPU. Then we want to reduce memory, however, we need to reduce the index size to half of the memory size to ensure it fits in the WiredTiger engine cacheSizeGB. If indexes don't fit in RAM, indexes are stored on disk which is extremely slow. We came up with a solution to archive some old development-purpose log data. After archived, we used the compact command to rebuild indexes and release disk space.
After all is done, we downgrade the memory tier in November. As you can see, monthly billing shifts over the year, there is a decrease in November. However, in the previous average read latency chart, there is a little increase around November that's the impact of downgrade memory but we accept that's the trade-off of cost reduction. We reached a point where we could offer high-performance, low-latency services to our growing business without risking cloud bankruptcy.

Future improvement
Index consistency
As creating index in MongoDB(> v4.2), MongoDB background is deprecated, create index will lock collection. We disabled auto index creation and use rolling index feature to create them. Then We facing a inconsistent indexes in code and production. We need develop a method to keep indexes in code and production database consistent.
Message queue
For some user-facing heavy queries we have a plan to push them to a message queue, let consumer to handle it asynchronously to make the original request fast.
Improve schema
Redesign schema is the most valuable but engineer resource expensive solution. For slow queries(~2s) in the previous section, we would need to improve the schema to make them faster.
For example, one of the lowest endpoints is to show Gmail client-like UI for pros to indicate inbox message count, etc. We have many complicated queries to get these numbers. If we have these numbers stored and computed in the background not synchronously computed in the runtime, this endpoint would have a huge improvement. Of course, data consistency is a challenge in this case.