こんにちは! Marco here, Engineering Manager at MeetsMore. This article is my contribution to our Advent Calendar 2025, a tradition where our engineering team shares insights and technical experiences each holiday season. Today, I'd like to discuss a project my team and I have been designing. What happens when we combine Gaming, Logistics, and Big Data? Let's find out!
NB: This article outlines the vision we are aiming for. Not all capabilities are available today.
TL;DR
Nowadays, we keep track of several data points like inventory, locations, and quantities. But what's the real value? It's not "digitizing the Excel sheet." It's using that data for people working in the field. Suggesting the optimal picking order, preventing stockouts before they happen, and recalculating routes when everything changes. We start with simple, explainable rules, then introduce ML when the data matures. Let's see how.
Introduction: Why Data Changes Everything
But what does it really mean to "become data-driven" in a warehouse? Good question.
On our platform, users can track inventory: what they have, where it's located, and in what quantity. So far, nothing revolutionary. If digitization were just this, a manually updated CSV would suffice. Spoiler: many companies still do exactly that. The real difference? It emerges when we integrate this data into a complete operational flow. A service request is created, assigned to an operator, N items are selected from the warehouse, the operator collects them following an optimized route and departs. It's here that data eliminates real friction.
From CSV to Smart Inventory
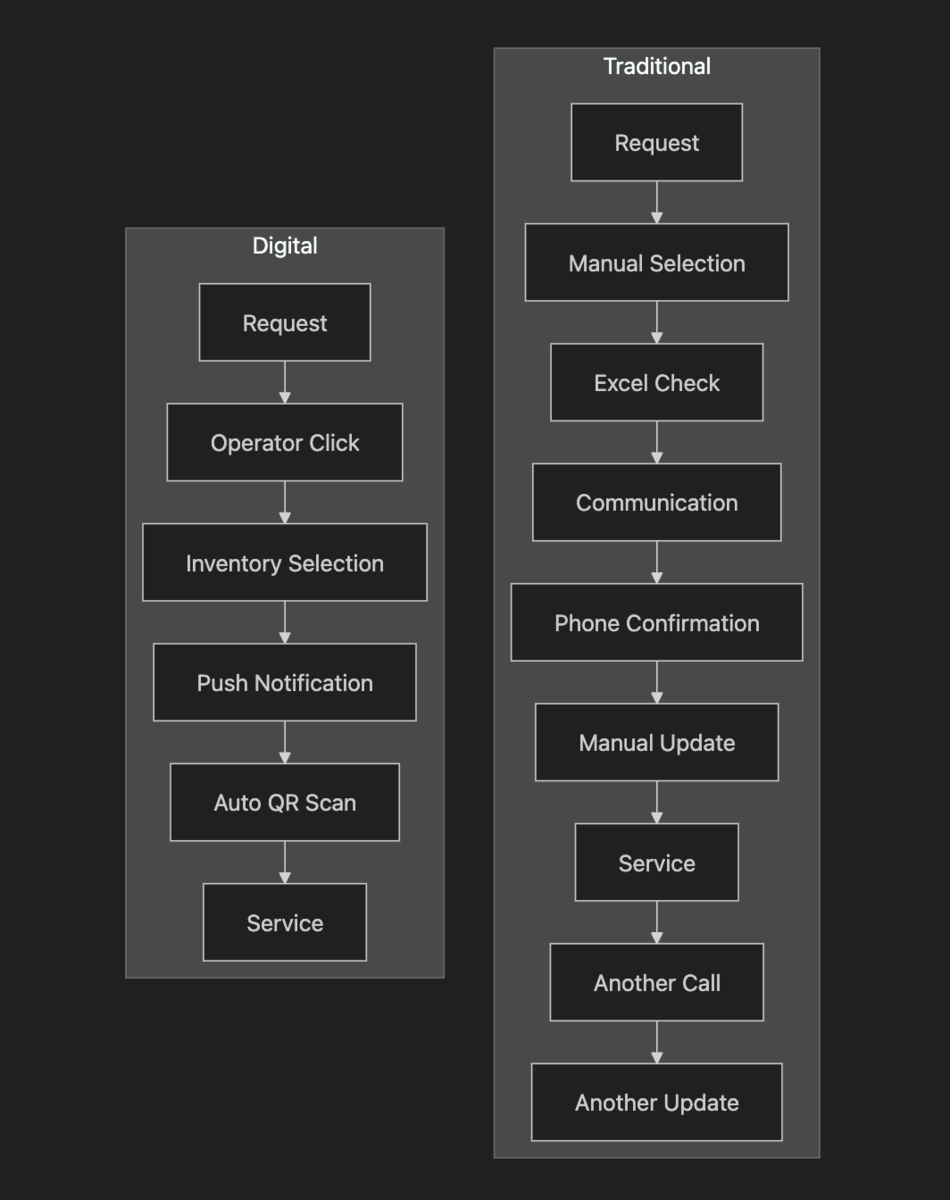
Let's compare two concrete scenarios.
Traditional Scenario (CSV, or pen and paper)
I receive a service request. I manually choose the operator. I check inventory on Excel. I communicate what equipment to retrieve and where to find it. The agent collects the items, calls me to confirm. I manually update the inventory status. The agent performs the work, calls when finished. I update the inventory again. I manually check that everything is consistent. If I'm a good manager, I also check stock levels.
Average time per operation: 25-30 minutes of administrative overhead
Error rate: High (wrong items, incorrect quantities, missed communications)
Smart Digital Scenario
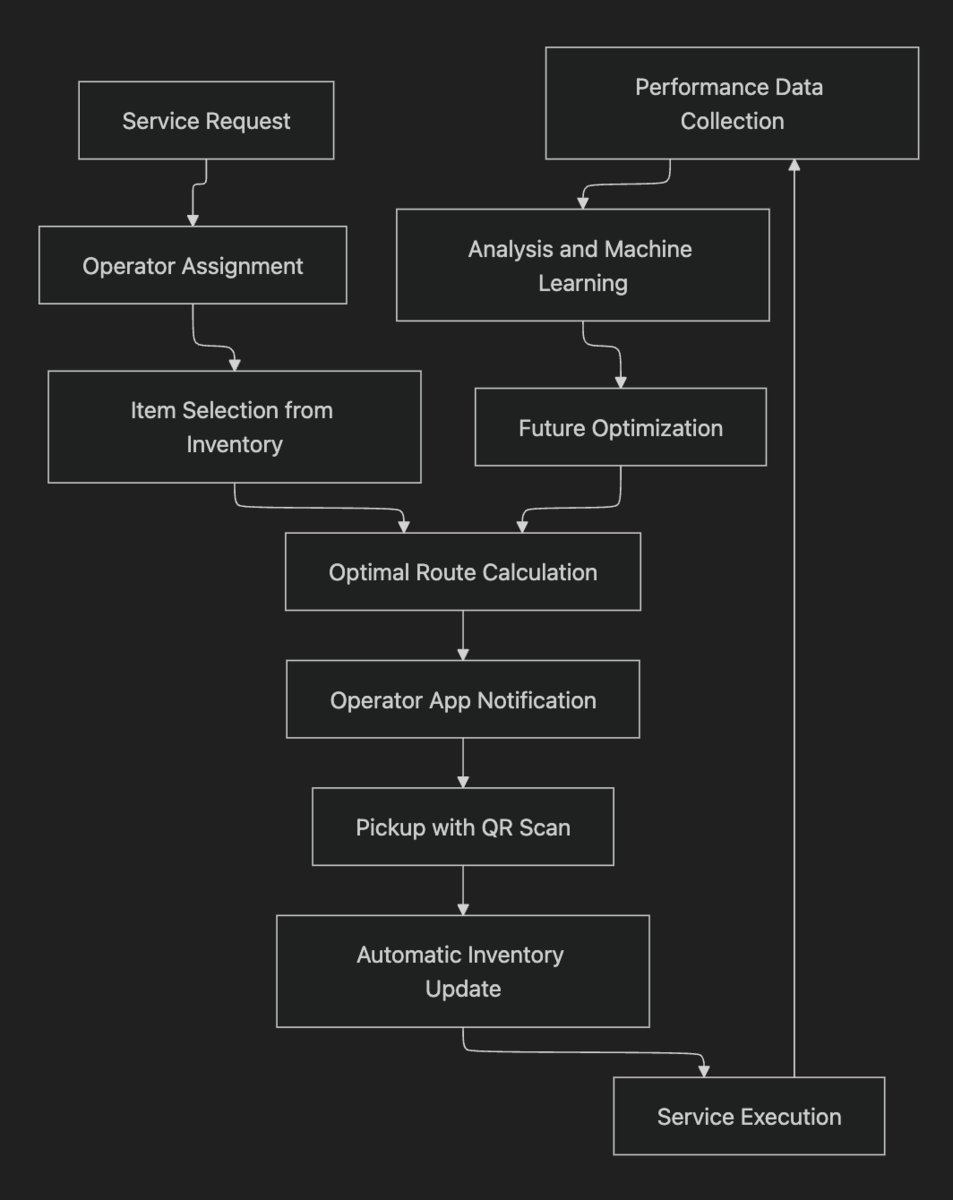
I create the service request from the admin dashboard. Operators are already in the database, so I can choose one with a click based on availability. I pick items from the digital inventory. Then the agent receives a notification in the app: what's needed, where to get it, how to get there. QR scanning automatically updates the inventory. The system alerts me if something is about to run out. Done.
Average time per operation: 3-5 minutes of administrative overhead
Error rate: Low (the workflow and its steps are predetermined)
ROI: 80% reduction in administrative time, 75% fewer errors
Concrete Use Cases: Where Data Makes the Difference
1. Stock Breakage Prediction
We can analyze consumption based on seasonality, service frequency, providing an estimate of when an item might run out. Before it happens.
Real example: we reduce air filter stockouts thanks to forecasts that also consider weather data. Abnormal temperatures? More emergency calls. More calls? Higher consumption. Simple.
2. Warehouse Space Optimization
We optimize the warehouse layout by analyzing which items are picked most often, and in what combinations. No magic, just data.
Real example: we reduce the average picking distance by 50 meters. An operator who makes 15 picks per day saves 750 meters of walking, about 10 minutes. Multiplied by 250 working days? 40 hours per year per operator. Free.
3. Seasonality Management
We analyze historical data to predict demand peaks and better organize warehouse and supply. No surprises.
Real example: air conditioners break down in summer, heaters in winter. Obvious? Sure. How many companies actually prepare? Few.
Technical Deep Dive: The Optimal Path Problem
Okay Marco, this is all nice, but where's the technical stuff? Here it is.
AI isn't just LLMs and generative models. It's a collection of disciplines as interesting as they are complex: machine learning, combinatorial optimization, algorithms. One classic problem? The Traveling Salesman Problem (TSP).
Simple formulation: "A salesman must visit N connected cities. Time is money: what's the shortest route that visits all cities exactly once?"
This problem was crucial in video games for NPC pathfinding. If we represent cities as nodes in a graph and roads as weighted edges (distance or time), finding the optimal path becomes a graph optimization problem. Algorithms like Dijkstra, A*, or heuristic approaches like 2-opt are established solutions. Old school, but effective.
From Video Game to Warehouse: The Real Complexity
Now imagine that the "salesman" is our field operator. They must start from a point (office, home, previous service location), visit one or more warehouses to collect material, reach the service location. But the problem gets complicated. Very complicated.
- The starting point can vary (the operator might already be in the field)
- Which warehouses to visit depends on what items are needed
- Roads can be blocked, congested, closed
- Some items might be available in multiple warehouses
- Picking time varies based on warehouse layout and operator experience
- Any event we can think of might happen
The issue isn't the map. It's something else:
- The information we gather during the route, and how we use it
- The information we gather after the route, and how we analyze it
This is where data comes into play. Finally.
Concrete Example: Joe, Bob and Diana
Take 3 operators: Joe, Bob and Diana. For simplicity, imagine that a customer requests the same maintenance 4 times a month. Over a year? 48 identical services. Each operator does 16. Same opportunities.
Data collected:
| Operator | Total Time | Service Time | Picking Time |
|---|---|---|---|
| Joe | 120 minutes | 60 minutes | 60 minutes |
| Bob | 100 minutes | 30 minutes | 70 minutes |
| Diana | 120 minutes | 70 minutes | 50 minutes |
The most obvious conclusion? "Bob is the fastest, let's assign everything to him." Well, wrong. The crucial data is the breakdown. Why?
Now the manager has real analytical tools:
- Why is Bob so fast at the service? Has he developed a particular technique? Can he share it?
- Why is Diana faster at picking? Does she know warehouse shortcuts?
- Bob takes longer picking: maybe the items he needs are poorly positioned?
The system can track everything:
- Travel time to each warehouse
- Item search time in the warehouse (from entrance to scan)
- Travel time to the customer
- Service time
- External conditions: traffic, weather, time of day
Sure, a good manager with a CSV could have the same questions, right? Maybe. But at a different stage, with less digital overhead. It might seem so. But data collection was only the first step.
Reinforcement Learning: The System That Learns
The collected data feeds a continuous learning cycle. Reinforcement learning applied to concrete problems, not chess.
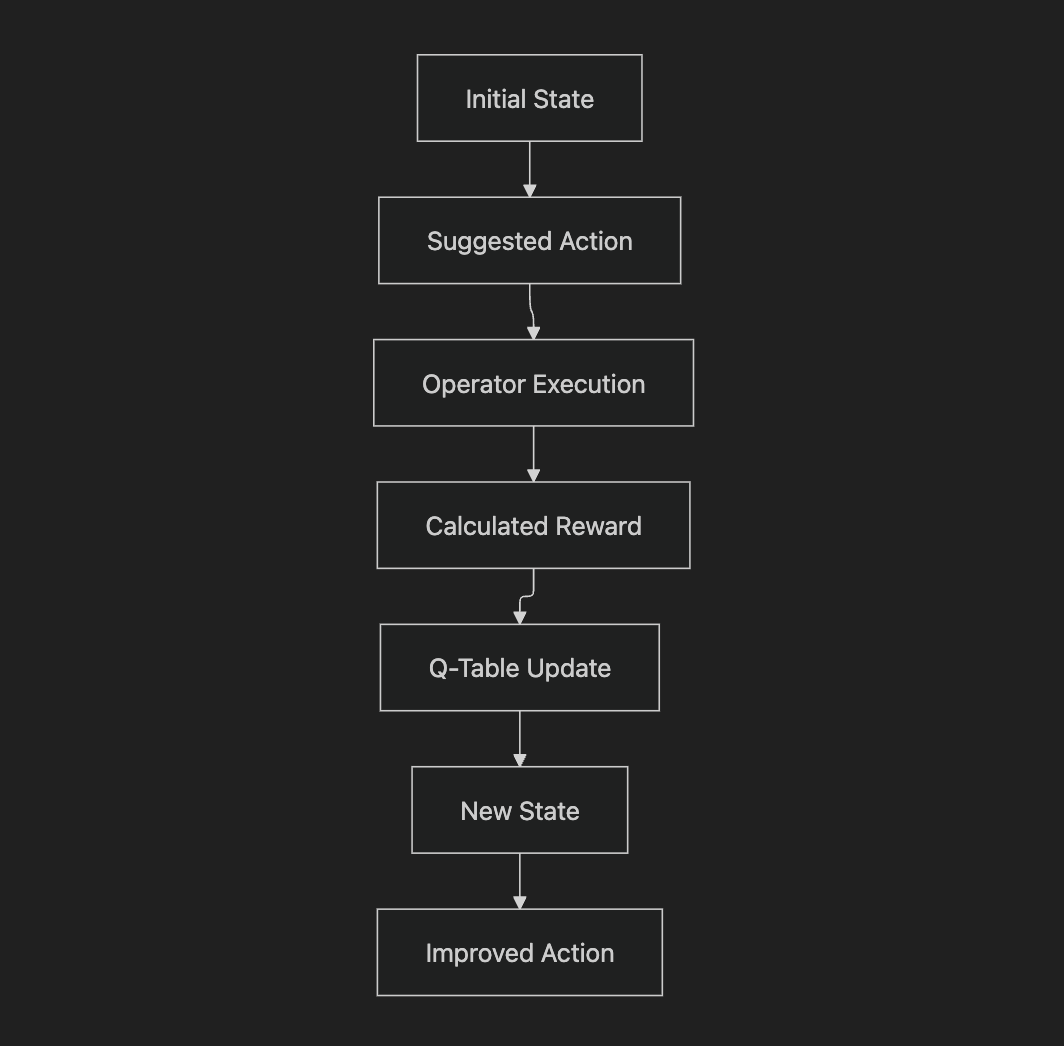
How Does the Feedback Loop Work?
Step 1 - Initial state: Operator X must perform service Y, items A, B, C are needed and available in warehouses M1 and M2
Step 2 - Action: The system suggests a route based on initial heuristics (distance, real-time traffic, item availability)
Step 3 - Execution: The operator follows (or doesn't follow) the suggestion. The system tracks everything.
Step 4 - Reward: We calculate a score based on total time, fuel consumed, and customer satisfaction
Step 5 - Learning: The model updates its estimates. If Bob saved time by taking a different route, the system increases the "value" of that choice for similar contexts. Simple.
Q-Learning Applied to Route Selection
We can model the problem as a Q-table. Where:
- States = combinations of (operator, starting point, items needed, time of day, day of week)
- Actions = possible routes (different sequences of warehouses to visit)
- Q-value = estimate of the "value" of that action in that state
Over time, the system learns complex patterns. Like: "On Tuesday morning, for this type of service, it's better to visit the north warehouse first because there's less traffic." Or: "Diana is faster in HVAC services when she picks up tools from the central warehouse, because she knows its layout better." Things that no CSV will ever tell you.
Big Data and Collective Insights
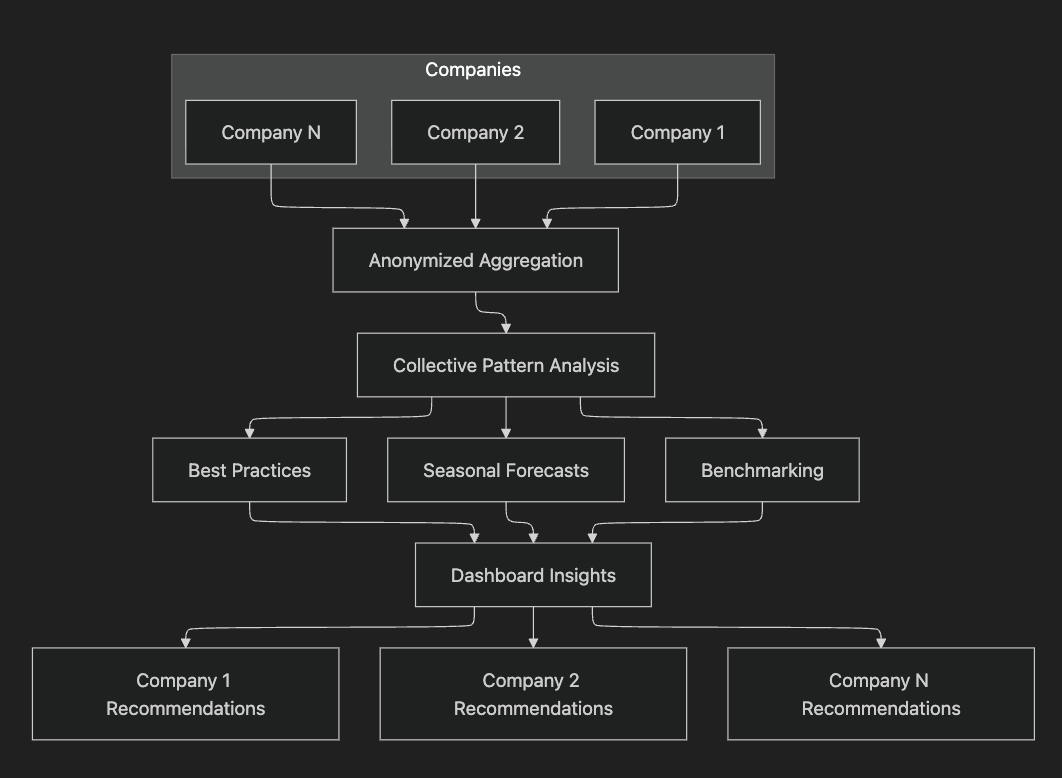
The real power? Comes when we aggregate data across multiple companies. Anonymized, of course.
Pattern Recognition Across Tenants
By analyzing hundreds of companies, we can identify best practices. For example:
- Companies in the top 10% for efficiency organize the warehouse with a "hot zone" layout (high-turnover items near the exit)
- The fastest operators tend to do batch picking when possible (if the same items are needed tomorrow, they pick everything today)
A company might see:
- "Your average picking time is 8 minutes. Similar companies (same size, same sector) do it in 6 minutes. Want to see what they do differently?"
- If 100 HVAC companies saw a spike in calls the week after a heat wave, we can predict you will see one too. The system suggests increasing refrigerant stock preventively, and tells you how long delivery will take
How do we provide this info to the user? In a useful way.
- Dynamic suggestions based on context
- Actionable dashboard:
- Operator Efficiency: Average time per service type, comparison with baseline, trend over time
- Inventory Health: Items at risk of stockout, stagnant items (high immobilized value), turnover rate
- Spatial Optimization: Warehouse heatmap (which zones are most visited), reorganization suggestions
- Forecasts: Expected demand by category for the next 30 days, comparison with current capacity
Infinite Variables, Infinite Possibilities
We've only scratched the surface. Imagine being able to consider:
- Real-time and historical traffic by time of day
- Dynamic warehouse locations (mobile warehouses, equipped vans)
- Type, weight, and volume of required material
- Physical characteristics of the operator (load capacity, experience, certifications)
- Load capacity of the available vehicle
- Weather conditions (rain slows travel by 15%)
- Customer priority (different SLAs for premium customers)
- Parking availability near the customer
- Access time windows (some companies accept technicians only during certain hours)
If it exists in the physical world, we can probably measure it, track it, and use it to optimize.
Conclusion: From Passive Warehouse to Active Intelligence
The data-driven transformation of a warehouse is not a project with a deadline, but a journey of continuous improvement. We start by collecting data, then use it to automate, and finally transform it into tools that help people work better.